
When something goes wrong with your website — or when you simply want to know what software environment your hosting account is running on — the System Information section in DirectAdmin is the first place to look. It gives you a real-time snapshot of your server's operating environment, including CPU usage, memory, disk space, installed software versions, and more. This guide shows you how to access this information and how to interpret what you see.
What Is System Information in DirectAdmin?
System Information is a read-only dashboard inside DirectAdmin that displays live and static details about the server your hosting account runs on. Unlike account-level statistics (which show your personal usage), System Information shows the server-wide environment — the operating system version, available memory, current load, software versions installed globally, and more.
This information is useful for web developers who need to know which PHP version is active, database administrators checking the MySQL version before running a migration, or anyone troubleshooting an incompatibility between their application and the server environment.
How to Access System Information
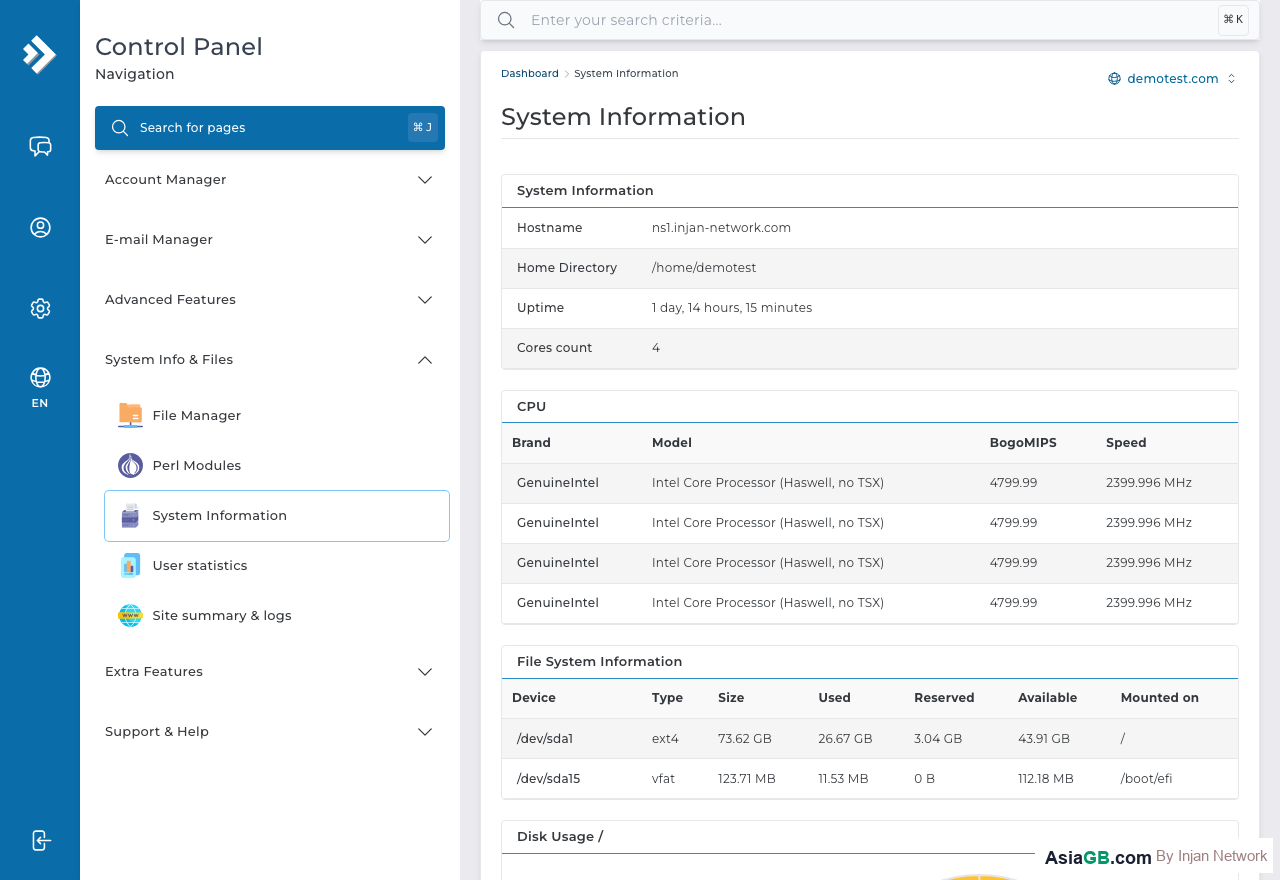
To open System Information in DirectAdmin, log in to your control panel and scroll to the System Info & Files section. Click System Information. The page will load and display current server details immediately — no configuration needed.
Information Displayed
The System Information page typically shows the following data, organized into clear sections:
Operating System
Shows the Linux distribution and kernel version running on the server. Common values include CentOS, CloudLinux, AlmaLinux, or Ubuntu, followed by the kernel release number. This is important when following server-specific documentation or troubleshooting OS-level issues.
CPU and Load Average
Displays the server's CPU model and the current load average over the past 1, 5, and 15 minutes. Load average represents how many processes are waiting to use the CPU. A load average significantly above the number of CPU cores indicates the server is under heavy stress.
Memory (RAM)
Shows total RAM, used RAM, and free RAM on the server. On shared hosting, this is the server-wide memory — not just your account's usage. Low available memory can cause slow page loads or 503 errors for all users on the server.
Disk Usage
Displays total disk capacity, used disk space, and free disk space. This is the server-wide disk, not your account quota. If the server disk is nearly full (above 90%), it can cause issues for all accounts, including write failures and email delivery errors.
PHP Version
Shows the currently active PHP version. This is the global server default — individual domains may use different PHP versions if configured via PHP Selector in DirectAdmin. Knowing your PHP version is critical when installing CMS platforms like WordPress, Joomla, or Magento that have minimum PHP version requirements.
MySQL/MariaDB Version
Displays the version of MySQL or MariaDB running on the server. Important when importing SQL dumps created on different MySQL versions, or when your application requires a specific minimum database version.
Apache / Web Server Version
Shows which web server software is running (usually Apache) and its version number. Relevant for troubleshooting .htaccess directives that may differ between Apache versions.
How to Use This Information
There are several practical ways to use what you see in System Information:
- Before installing a CMS or application — check PHP and MySQL versions to confirm compatibility with the software you plan to install.
- Troubleshooting errors — if your site suddenly breaks after a server update, checking which versions changed can point you to the cause.
- Planning upgrades — if you see the server is running an older PHP version, you can plan to test your application for compatibility before requesting an upgrade.
- Checking server health — high load average or very low free RAM can explain intermittent slowness on your site.
What Red Disk Usage Means
Some DirectAdmin interfaces highlight disk usage in red when it reaches a critical threshold (typically above 80–90% capacity). Red disk usage is a warning that the server's storage is nearly full. In this state, you may experience file write failures, email delivery problems, or MySQL errors. If you notice this, contact your hosting provider immediately or take action to free up space by removing unused files, old backups, or large log files.
Important: Always check disk usage before creating a full account backup. If the server disk is nearly full, a large backup operation could fill the remaining space and cause errors mid-process. Ensure you have enough free space before starting a backup.
Understanding Load Average in Detail
Load average is one of the most misunderstood metrics in hosting environments. DirectAdmin displays three numbers separated by spaces — these represent the average number of runnable processes over the last 1, 5, and 15 minutes respectively.
The key insight is that these numbers are only meaningful when compared against the number of CPU cores available to the server. On a 4-core server, a load average of 4.0 means the CPU is fully utilized — every core is busy, but no process is waiting. A load average of 8.0 on the same server means processes are queuing for CPU time, which will cause slowdowns across all hosted sites.
Reading Load Average Trends
- 1-minute much higher than 15-minute — A sudden spike has occurred. Monitor for a few minutes to see if it's a temporary burst or ongoing issue.
- 15-minute much higher than 1-minute — The server was under load recently but is recovering. Usually safe to wait and observe.
- All three values consistently high — Sustained high load. This is the most serious pattern and warrants immediate investigation.
- All three values low — Server is healthy and has capacity for more traffic or resource-intensive tasks.
Disk Usage: Space vs. Inodes
Most hosting users focus on disk space (gigabytes), but there is a second metric that is equally important: inodes. An inode is a data structure that represents a file or directory in the filesystem. Every file and directory on the server consumes one inode, regardless of its size.
Some types of websites generate enormous numbers of small files. WordPress caching plugins, for example, can create hundreds of thousands of cache files. Sessions stored as individual files, log files, and compiled template caches can all contribute to high inode usage. When a server's inode limit is reached, new files cannot be created — even if gigabytes of disk space remain available.
Disk Usage Warning Thresholds
- Below 70% — Healthy. No action needed.
- 70–80% — Monitor and plan ahead. Consider removing old backups, log files, or unused files.
- 80–90% — Warning zone. Clean up files or contact support to discuss storage expansion.
- Above 90% — Critical. File write failures, email delivery problems, and MySQL errors are likely. Take immediate action.
Using System Information Alongside Other DirectAdmin Tools
System Information provides the big picture of server health, but it works best when combined with other tools in your DirectAdmin control panel.
Cross-Reference with Site Logs
When load average spikes or you notice slow page loads, check your error logs in Site Summary & Statistics > Logs. Repeated PHP fatal errors, unhandled exceptions, or 500-level responses can generate high server load even on a lightly-trafficked site. Error logs will often reveal the specific script or plugin causing the problem.
Cross-Reference with User Statistics
User Statistics in DirectAdmin shows your own account's bandwidth and disk usage in detail. This helps you determine whether a disk space warning in System Information is caused by your account or by other accounts on the shared server — important context when deciding whether to take action yourself or report the issue to support.
When to Contact Support
While you can read and interpret System Information on your own, certain situations warrant opening a support ticket:
- The 15-minute load average has been above 2× your expected threshold for more than an hour with no obvious cause.
- Free RAM is consistently below 10% of total RAM, causing intermittent 503 errors.
- Disk usage is above 85% and you cannot identify what is consuming the space.
- The PHP version shown does not match what your application requires and the PHP Selector doesn't offer the version you need.
- You notice the MySQL version is older than the minimum required by your application or CMS.
When opening a ticket, include a screenshot of the System Information page along with the time the issue occurred. This gives the support team the server-side context needed to investigate efficiently. For customers who need greater control over server resources, upgrading to a VPS plan provides root access and the ability to manage processes, memory limits, and software versions directly.
SSD Hosting with Expandable Storage
AsiaGB hosting runs on fast SSD storage. Check our plans for the right disk space to suit your website's needs.
View Hosting Plans