
Your website generates detailed log files every time a visitor accesses a page, a file is requested, or an error occurs. DirectAdmin gives you access to these logs through the Site Summary and Logs section — a powerful diagnostic tool that helps you understand your site's traffic patterns, identify broken links, detect unauthorized access attempts, and troubleshoot application errors. This guide explains how to access and interpret these logs.
What Is Site Summary?
Site Summary in DirectAdmin is a statistics overview that aggregates your access log data into readable reports. It shows you visitor counts, most-visited pages, top referring sites, visitor browser and OS breakdown, and error summaries. Think of it as a lightweight analytics dashboard built directly into your control panel — no third-party tools required.
Site Summary is powered by log analysis tools like Webalizer or AWStats (depending on your server configuration), which process your raw access log files and present the data in charts and tables.
Access Log vs Error Log
DirectAdmin maintains two main types of log files for your website:
- Access Log — Records every successful and unsuccessful HTTP request to your website. Each line represents one request and includes the visitor's IP address, the requested URL, the HTTP status code returned, the date and time, the referrer URL, and the visitor's user agent (browser and OS).
- Error Log — Records server-side errors that occur when processing requests. This includes PHP fatal errors, missing file errors (404), permission errors (403), server crashes (500), and misconfigured rewrite rules.
How to Access Logs in DirectAdmin
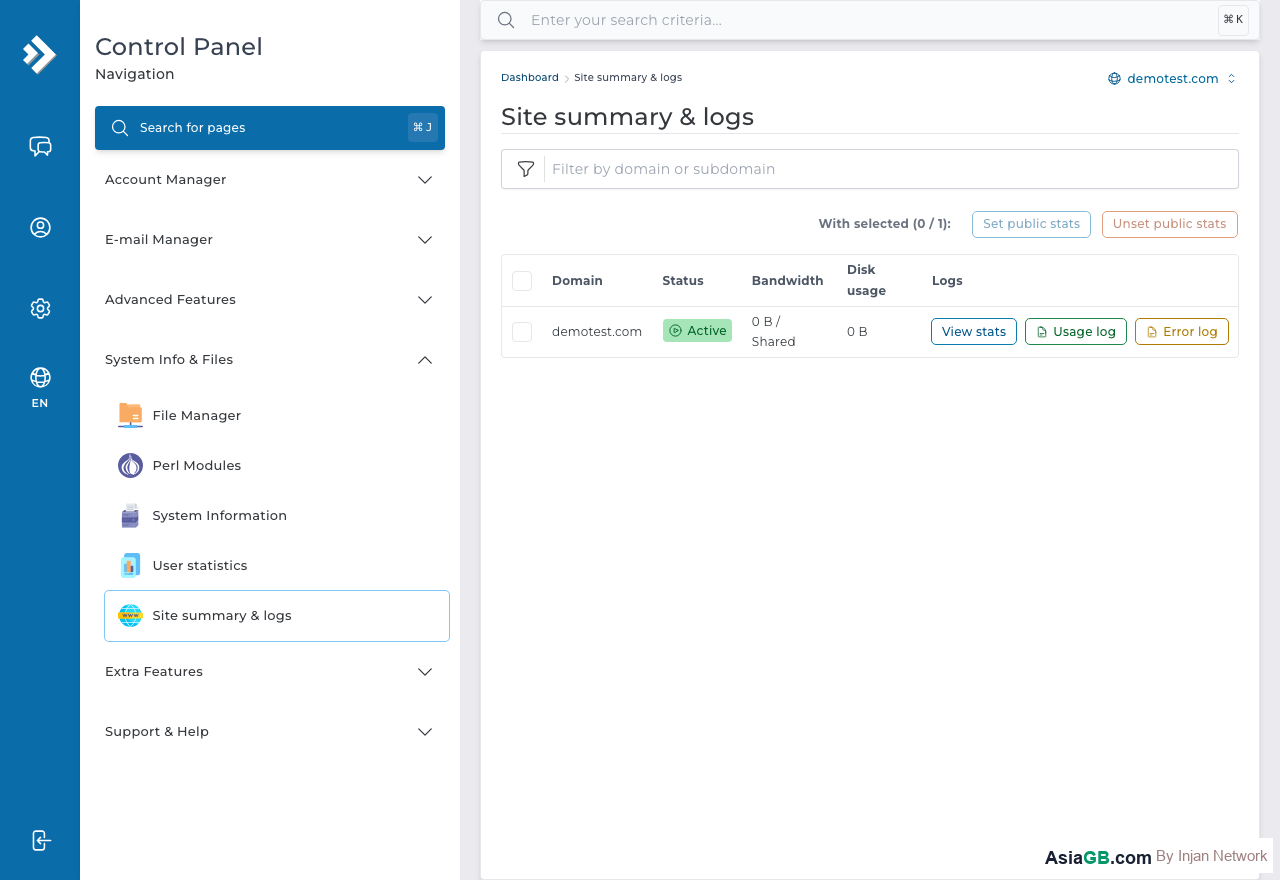
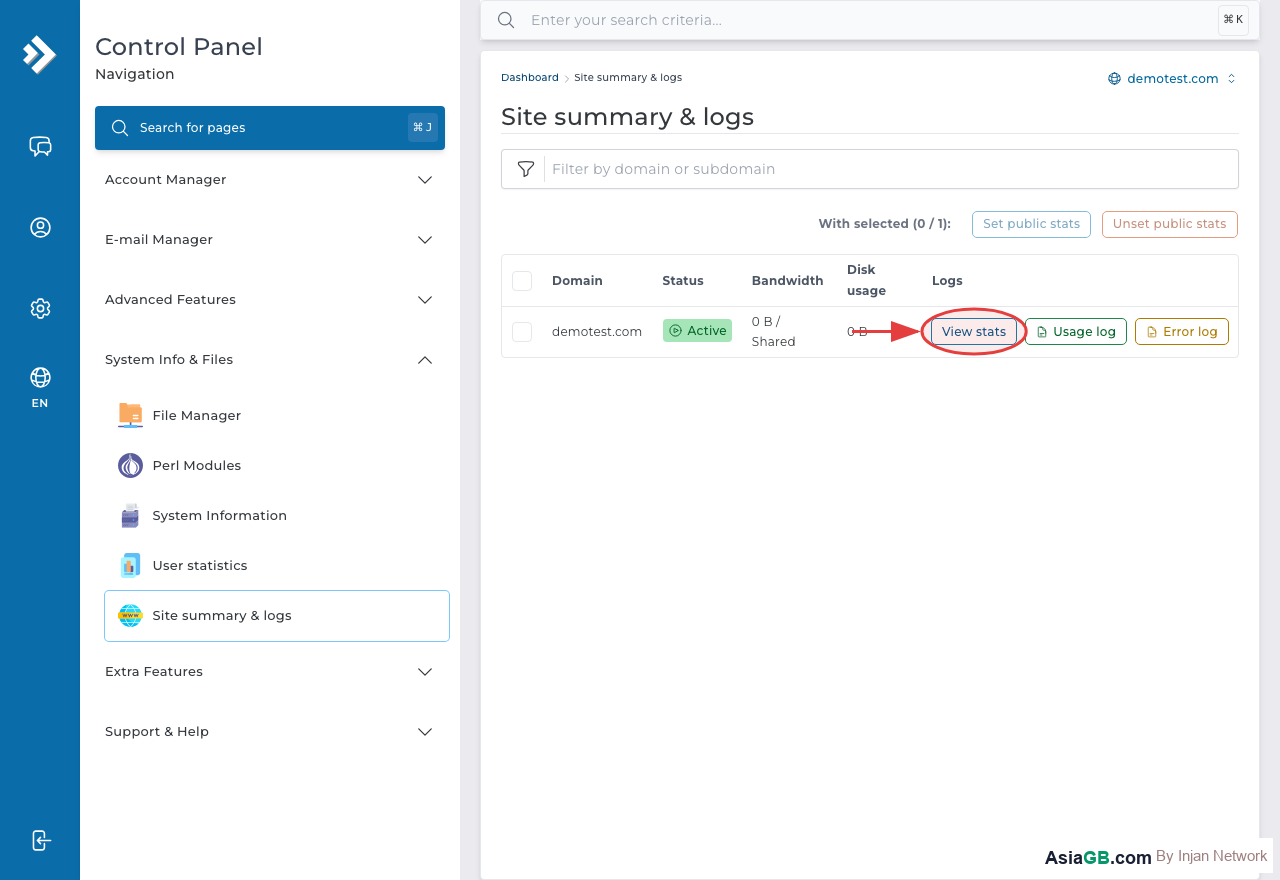
To view your site logs, log in to DirectAdmin and navigate to System Info & Files, then click Site Summary / Logs. You will see options to view the statistics summary or to browse and download the raw log files. The log files are also accessible directly through the File Manager in the logs/ directory of your home folder.
Reading the Access Log
Raw access log files use the Combined Log Format, which looks like this:
192.168.1.1 - - [10/May/2026:14:32:01 +0700] "GET /page.html HTTP/1.1" 200 4523 "https://google.com/" "Mozilla/5.0..."
Here is what each part means:
- 192.168.1.1 — The visitor's IP address
- [10/May/2026:14:32:01 +0700] — Date and time of the request
- GET /page.html HTTP/1.1 — The HTTP method and the URL requested
- 200 — HTTP status code (200 = success, 301 = redirect, 404 = not found, 500 = server error)
- 4523 — Response size in bytes
- "https://google.com/" — The referring page (where the visitor came from)
- "Mozilla/5.0..." — The visitor's user agent (browser and operating system)
Error Log — Common Error Types
The error log is your best friend when debugging website problems. Common entries you will encounter include:
- PHP Fatal error — A PHP script encountered a critical error and stopped. Check the filename and line number mentioned in the error.
- File not found (404) — A requested file does not exist. Often indicates broken links or incorrect file paths.
- Permission denied (403) — The server refused access due to incorrect file permissions or directory listing restrictions.
- mod_rewrite errors — Problems with
.htaccessrewrite rules, often caused by incorrect syntax or incompatible directives. - PHP Deprecated / Warning — Non-fatal PHP notices that do not stop execution but indicate code that may break in future PHP versions.
Downloading Logs for Analysis
For detailed analysis, you can download the raw log files to your local computer and process them with tools like GoAccess (a terminal-based log analyzer) or import them into spreadsheet software. To download, navigate to the logs/ folder in the File Manager, right-click the log file, and choose Download. Log files are named by domain and date, such as yourdomain.com-access_log.
Large websites can generate log files of several hundred megabytes per day. If your log files are growing very large, consider configuring log rotation or disabling logging for static assets like images and CSS files to reduce log size.
Best Practice: Check your error log regularly — ideally once a week — to catch hidden PHP errors that don't show on screen but silently consume server resources or signal security issues. Many hacked websites show unusual 404 patterns or PHP errors in the error log days before the problem becomes visible to visitors.
Types of Logs in DirectAdmin
DirectAdmin collects several distinct log types, each recording a different layer of server activity. Understanding what each log covers helps you go straight to the right file when diagnosing a problem.
Access Log
The access log records every HTTP and HTTPS request made to your website — successful responses, redirects, 404 errors, and everything in between. Each entry captures the visitor's IP address, the exact URL requested, the HTTP status code returned, the response size, the referring page, and the browser/OS string. This log is the primary source for traffic analysis, bot detection, and identifying broken links.
Error Log
The error log captures server-side failures: PHP fatal errors, missing files, permission denials, and Apache configuration problems such as malformed .htaccess directives. When your site returns a 500 error or a page fails to load correctly, the error log is the first place to check. It records the exact filename and line number where a PHP error occurred, dramatically reducing debugging time.
FTP Log
The FTP log records all connections and file transfer operations made over FTP, including failed login attempts. If you suspect unauthorized access to your hosting account, reviewing the FTP log will reveal which IP addresses have been attempting to connect and whether any logins succeeded. Repeated failed attempts from an unfamiliar IP is a strong signal to rotate your FTP password immediately.
Email Log (Exim)
DirectAdmin uses Exim as its mail transfer agent. The Exim log records every inbound and outbound email message — including delivery attempts, bounces, and rejections. If an email you sent never arrived, or if you suspect your domain is being used to send spam, the Exim log provides a full audit trail with timestamps, sender addresses, recipient addresses, and delivery status codes.
Understanding Apache Combined Log Format
Apache access logs use the Combined Log Format, an industry-standard structure that is both human-readable and easily parsed by log analysis tools. Here is a sample line with each field explained:
203.0.113.5 - - [08/Jun/2026:14:22:10 +0700] "GET /contact.html HTTP/1.1" 200 8734 "https://www.google.com/" "Mozilla/5.0 (Macintosh; Intel Mac OS X 10_15_7) AppleWebKit/537.36"
- 203.0.113.5 — Visitor IP address. Multiple requests from the same IP in rapid succession may indicate a bot or crawler.
- [08/Jun/2026:14:22:10 +0700] — Date and time of the request in the server's local timezone.
- GET /contact.html HTTP/1.1 — HTTP method (GET, POST, PUT, DELETE), the requested path, and the HTTP protocol version.
- 200 — HTTP status code. 200 means success; 301/302 are redirects; 404 means the file was not found; 500 means an internal server error occurred.
- 8734 — The size of the response body in bytes, excluding headers. Useful for estimating bandwidth consumption.
- "https://www.google.com/" — The referrer: the URL of the page that linked to this request. A dash (
-) means the visitor typed the URL directly or the referrer was suppressed. - "Mozilla/5.0..." — The user agent string, which identifies the browser and operating system. Bots typically have recognizable user agents such as
GooglebotorAhrefsBot.
Using Logs to Diagnose Common Website Errors
Log files make error diagnosis systematic rather than guesswork. Here is how to approach the three most common HTTP errors using your DirectAdmin logs.
Diagnosing HTTP 500 Errors
Open the error log and search for lines containing PHP Fatal error or Internal Server Error near the timestamp when the problem occurred. The error log will name the PHP file and the exact line number where execution stopped. Common causes include a missing function, a syntax error introduced by a recent code edit, or an incompatible plugin after a WordPress update.
Finding Broken Links (HTTP 404)
Filter your access log for lines where the status code is 404. Repeated 404 requests for the same URL indicate a broken internal or external link that should be fixed with a 301 redirect. An unusual pattern — such as hundreds of 404 requests for paths like /wp-login.php or /administrator/index.php — signals automated scanning for vulnerable scripts.
Investigating HTTP 403 Errors
A 403 response means the server understood the request but refused it. Check the error log for client denied by server configuration entries. This usually means a .htaccess Deny rule was triggered, incorrect file permissions are blocking access, or an IP restriction rule is working as intended. The log will show the exact IP and URL that was denied, helping you confirm whether the block is legitimate.
Managing Log File Size with Log Rotation
On a busy website, access log files can grow by hundreds of megabytes per day. Without a log management strategy, your disk quota will fill up — stopping Apache from writing logs, which in turn can prevent the web server from serving pages correctly.
How Log Rotation Works
Log rotation is the process of automatically compressing, archiving, and deleting old log files on a scheduled basis. The standard Linux tool logrotate handles this at the system level on DirectAdmin servers. A typical rotation policy might keep the current log uncompressed, compress logs older than one day with gzip, retain compressed archives for 30 days, and delete anything older.
Practical Steps to Reduce Log Size
- Exclude static assets — Configure Apache to skip logging requests for images, CSS, and JavaScript files. These typically account for 60–80% of all requests but provide little diagnostic value. This single change can reduce access log volume dramatically.
- Download and delete old logs — Download raw log files to your local machine for offline analysis, then delete them from the server to reclaim disk space.
- Use AWStats or Webalizer — These tools process raw logs into summarized HTML reports. Once processed, the raw log files can be safely deleted while the aggregated statistics are retained.
- Compress with gzip — Plain text log files compress at ratios of 10:1 or better. A 500 MB access log typically compresses to under 50 MB.
AsiaGB hosting manages system-level log rotation automatically, so your disk space is protected. You can still download historical logs through the File Manager in DirectAdmin whenever you need to perform a deep analysis.
Hosting with Full Log File Access
AsiaGB hosting gives you full access to your site logs through DirectAdmin so you can troubleshoot and optimize with complete visibility.
View Hosting Plans